Analytics & Reporting
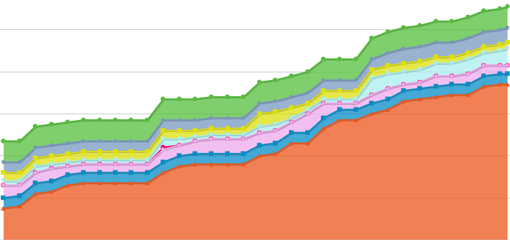
Cumulative Flow
The Cumulative Flow diagram shows how many tasks there are in different columns over time.
Use the diagram to analyze your workflow and identify bottlenecks.
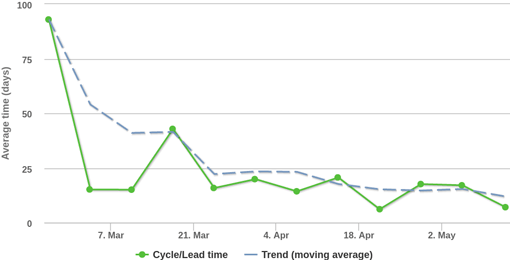
Cycle & Lead time
The Cycle/Lead time chart shows how long it has taken for tasks to move between different columns in your workflow.
Use it to see if you become faster or slower at delivering value to your customers.
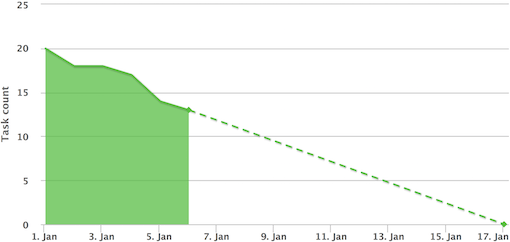
Burndown
The Burndown chart shows how many tasks remain to be done.
Track progress over time and predict when all work will be done.
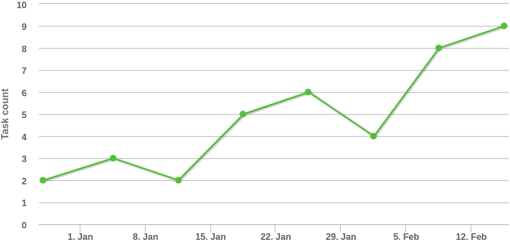
Throughput
The Throughput chart shows how many tasks are moving through a column.
Measure the performance of your system and how much value you are producing.
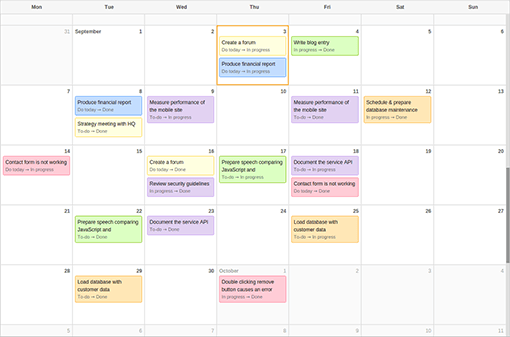
Calendar
Get a better overview of when your tasks are due with the calendar view. Filter on user, color, labels or swimlane.
You can also show the dates in your external calendar by subscribing to a feed.
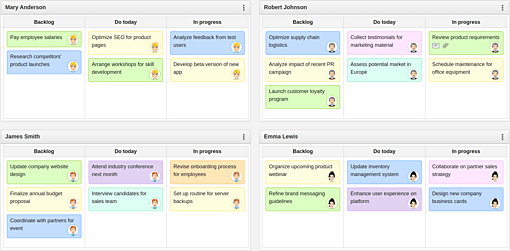
Dashboard
The dashboard can show information from multiple boards on the same page.
Design your dashboard freely by adding widgets. Specify board, columns, filter and task settings per widget.
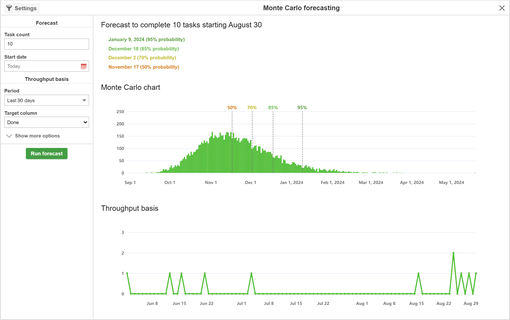
Monte Carlo forecasting
Spending a lot of time on estimates? Use forecasts instead to predict when your tasks will be completed.
The forecast is based on running 1000s of simulations from your historical throughput. Forecasting can be just as accurate as estimates, but gives you more time for work.
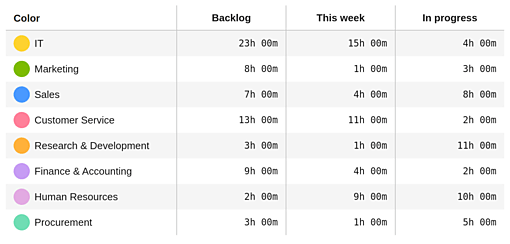
Time estimate & Task count
Get an overview of the estimated workload on your board. Identify if someone on your team has an unrealistic amount of work assigned to them.
Not using estimates? You can still get a good overview of your workload just by analyzing the number of tasks in different columns.
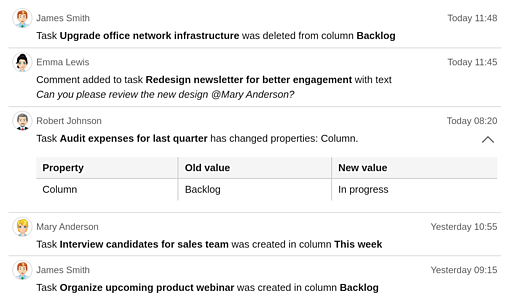
Board & Task history
See a detailed log of changes that are made on the board. Or for a specific task.
Filter the history log by user or type of change. Compare a field's value side-by-side before and after the change.
Boost your productivity today!
KanbanFlow is simple to use, yet flexible enough for most needs. You will be up and running in a few minutes after you have signed up. That’s how a Lean project management tool should work.